Event Analytics
From the moment you finish creating an event, the strmz.io platform starts compiling the attendee analytics for the event and making them available to you, in real-time, whether the event is in the future, currently happening or completed!
In the following sections, we describe what analytics you can expect to see and download during the three lifecycle phases of the event:
- Pre-event: From the time the event is created until the time the event starts streaming.
- In-event: While the event is being streamed.
- Post-event: After the event has been completed.

Pre-event Analytics
To navigate to the pre-event analytics for an Upcoming event, just click on the Attendee Analytics icon for the event, in the Upcoming events table. This will launch the analytics overview in a pop-up window.
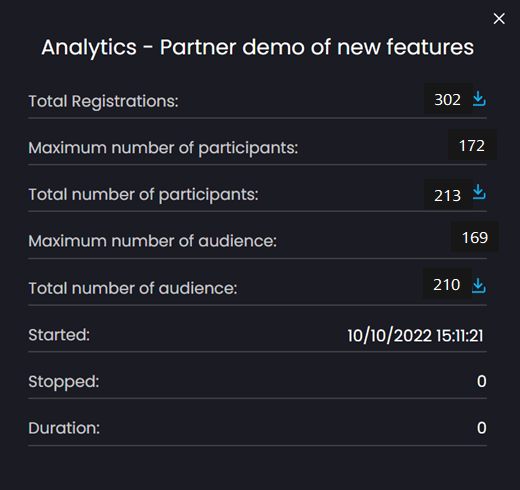
In the Analytics window, before the event has taken place, you will see the following statistics populated:
- Total Registrations: This is the total number of people (as identified by unique, validated email addresses) who have registered to join the audience for this event so far.
- Total number of participants: This is the total number of people (as identified by unique, validated email addresses) who have joined this event so far. Only members of the event panel (i.e. hosts, guest speakers and moderator) are allowed to join the event more than half an hour before it starts, so that they can rehearse. As such, the number of people shown here will reflect:
- If more than half an hour before the scheduled start time of the event: the number of hosts, guests and moderators that have, so far, joined the event to register and/or rehearse.
- If less than half an hour before the scheduled start time of the event: the total number of hosts, guest, moderator AND audience, where the audience are assembling in the Audience lobby.
- You may also see the Maximum number of participants field populated with a number greater than 0. This field indicates how many people have actually joined the event at the same time. While in pre-event stage, if this is non-zero, this just means that some of the event panel have assembled in the green room of the event to prepare and rehearse.
To download a list of all registrations and participants, as a plain text, comma-separated file, just click on the Download icon in either the Total Registrations row or the Total number of participants row, to download a file called Participants Analytics.
When the Participants Analytics file has completed download, you can open it with any document editor or spreadsheet application. For each person who registered, the downloaded file will have the following fields populated: name, role within the event (audience, host, moderator, guest speaker), email address, company name, title and the timestamp associated with their registration.
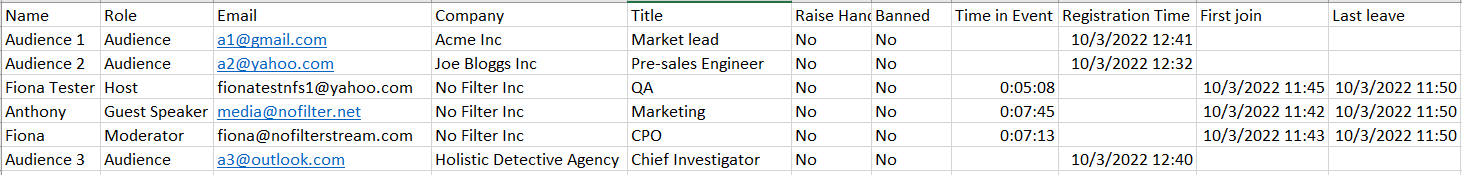
Below is an example of the contents of a Participants Analytics file during the pre-event phase. Note:
- Registration timestamps will be shown for everyone who registered to join the audience.
- A First Join timestamp will be shown for hosts, guest speakers and moderators, as they're allowed to join whenever they like, to rehearse. While in pre-event phase, the Time in Event and Last Leave fields simply reflect the duration of the rehearsal.
In-event Analytics
To navigate to the in-event analytics for an event that is currently live, just navigate to the event in the Upcoming events table and click on the Attendee Analytics icon. This will launch the analytics overview in a pop-up window.
This time you will see a few more fields of the Analytics window populated.
In the Analytics window, while the event is streaming, you will see the following live statistics populated:
- Total Registrations: This is the total number of people (as identified by unique, validated email addresses) who registered to join the audience for this event.
- Total number of participants: This is the total number of people (as identified by unique, validated email addresses) who have joined event so far, including audience members, hosts, guest speakers and moderator.
- Maximum number of participants: This field indicates the maximum number of people (as identified by unique, validated email addresses) who were in the event at the same time. This is almost always less than the total number of participants, as people can arrive late, leave early or even drop from the event for a few minutes.
- Total number of audience: This is the total number of people (as identified by unique, validated email addresses) who have joined the audience of the event so far, i.e. it does not include hosts, guest speakers and moderator. This is the field that is compared against your allocated Audience Size, at the end of the event, to determine if an overage charge applies, as described in Event Overage Calculations.
- Maximum number of audience: This field indicates the maximum number of people (as identified by unique, validated email addresses) who were in the audience of the event at the same time. This is almost always less than the total number of audience, as people can arrive late, leave early or even drop from the event for a few minutes.
- Started: The timestamp of when the event started streaming.
To download a list of all registrations and participants, as a plain text, comma-separated file, just click on the Download icon in either the Total Registrations row or the Total number of participants row, to download a file called Participants Analytics. When the Participants Analytics file has completed download, you can open it with any document editor or spreadsheet application. For each person who registered, the downloaded file will have the following fields populated: name, role within the event (audience, host, moderator, guest speaker), email address, company name, title and the timestamp associated with their registration. For each registered person who has now joined the event, the First Join timestamp will also be populated.
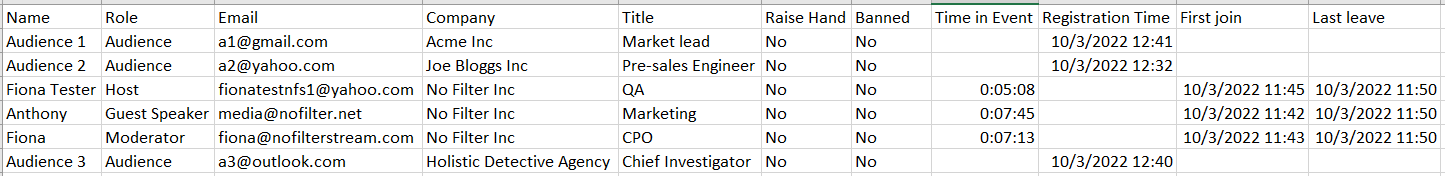
Below is an example of the contents of a Participants Analytics file during the event. Note:
- Registration timestamps will be shown for everyone who registered to join the audience.
- A First Join timestamp will be shown for all hosts, guest speakers, moderator and audience members who joined the event one or more times (it is possible for an attendee to join, leave and then rejoin).
- A Last Leave timestamp will be shown for all hosts, guest speakers, moderator and audience members who joined the event and then left (it is possible for an attendee to join, leave and then rejoin).
- Time in Event is the total length of time each person spent in the event. It may be less than the time between their First Join timestamp and their Last Leave timestamp, e.g. if that person exited for a while and then rejoined.
- It is easy to see the people who registered but did not attend - they are the participants, in the file, who do have a Registration timestamp, but who do not have a First Join timestamp.
- Raise Hand indicates whether or not an audience member raised their hand, to request to join the live stream.
- Banned indicates whether or not an audience member was banned from the event.
Note: If you want to get a list of registrations and attendance by Audience members only, i.e. omitting the hosts, guest speakers and moderator, just click on the Download icon in the Total number of audience row, to download an Audience Analytics file. This file has exactly the same format as the Participant Analytics file, but lists only those people who joined the audience.
Post-event Analytics
To navigate to the post-event analytics for an event that has ended, just navigate to the event in the Completed events table and click on the Attendee Analytics icon. This will launch the analytics overview in a pop-up window.
This time you will see all of the fields of the Analytics window populated.
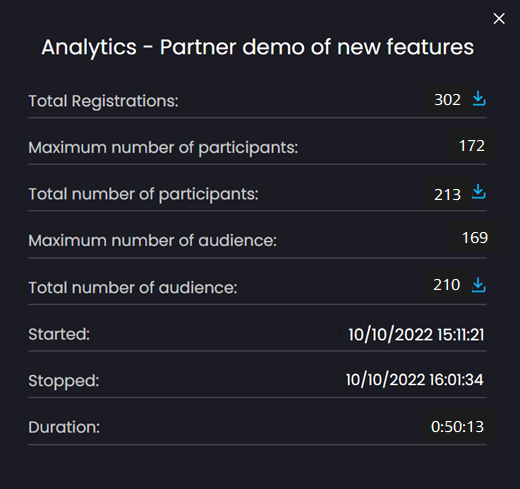
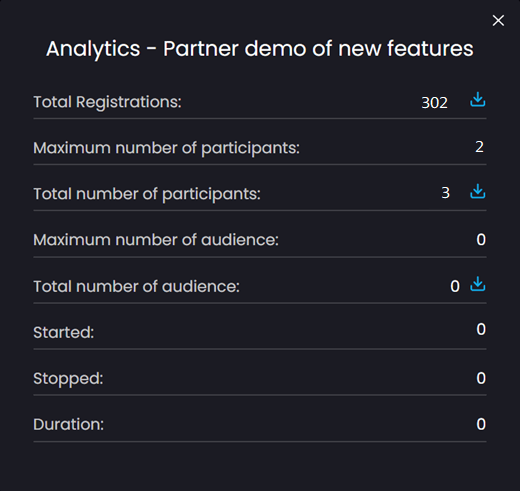
In the Analytics window, when the event is over, you will see the following statistics populated:
- Total Registrations: This is the total number of people (as identified by unique, validated email addresses) who registered to join the audience for this event.
- Total number of participants: This is the total number of people (as identified by unique, validated email addresses) who joined the event, including audience members, hosts, guest speakers and moderator.
- Maximum number of participants: This field indicates the maximum number of people (as identified by unique, validated email addresses) who were in the event at the same time. This is almost always less than the total number of participants, as people can arrive late, leave early or even drop from the event for a few minutes.
- Total number of audience: This is the total number of people (as identified by unique, validated email addresses) who joined the audience of the event, i.e. it does not include hosts, guest speakers and moderator. This is the field that is compared against your allocated Audience Size, at the end of the event, to determine if an overage charge applies, as described in Event Overage Calculations.
- Maximum number of audience: This field indicates the maximum number of people (as identified by unique, validated email addresses) who were in the audience of the event at the same time. This is almost always less than the total number of audience, as people can arrive late, leave early or even drop from the event for a few minutes.
- Started: The timestamp of when the event started streaming.
- Stopped: The timestamp of when the event stopped streaming.
- Duration: The length of time for which the event streamed.
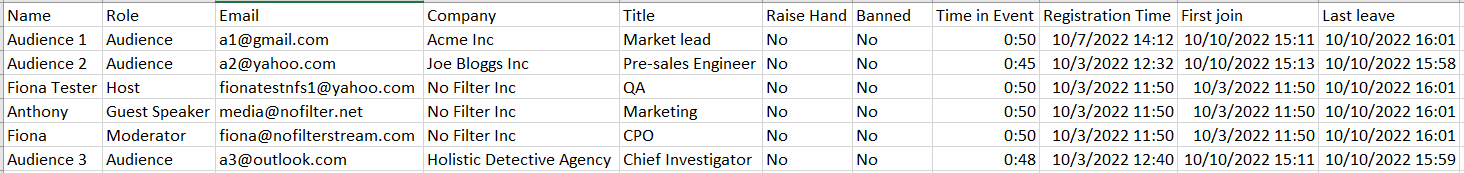
To download a list of all registrations and participants, as a plain text, comma-separated file, just click on the Download icon in either the Total Registrations row or the Total number of participants row, to download a file called Participants Analytics. When the Participants Analytics file has completed download, you can open it with any document editor or spreadsheet application. For each person who registered, there will be a row in the downloaded file, which will contain the following information: name, role within the event (audience, host, moderator, guest speaker), email address, company name, title and the timestamp associated with their registration. For each registered person who joined the event, the First Join timestamp, Last Leave timestamp and Time in Event will also be populated.
Below is an example of the contents of a Participants Analytics file during the post-event phase. Note:
- Registration timestamps will be shown for everyone who registered to join the audience.
- A First Join timestamp will be shown for all hosts, guest speakers, moderator and audience members who joined the event one or more times (it is possible for an attendee to join, leave and then rejoin).
- A Last Leave timestamp will be shown for all hosts, guest speakers, moderator and audience members who joined the event and then left (it is possible for an attendee to join, leave and then rejoin).
- Time in Event is the total length of time each person spent in the event. It may be less than the time between their First Join timestamp and their Last Leave timestamp, e.g. if that person exited for a while and then rejoined.
- It is easy to see the people who registered but did not attend - they are the participants, in the file, who do have a Registration timestamp, but who do not have a First Join timestamp.
- Raise Hand indicates whether or not an audience member raised their hand, to request to join the live stream.
- Banned indicates whether or not an audience member was banned from the event.
Note: If you want to get a list of registrations and attendance by Audience members only, i.e. omitting the hosts, guest speakers and moderator, just click on the Download icon in the Total number of audience row, to download an Audience Analytics file. This file has exactly the same format as the Participant Analytics file, but lists only those people who joined the audience.